The State of
Corporate Sustainability
Moving Beyond Energy Optimization
on the Journey to Net Zero

Welcome to the first annual State of Corporate Sustainability Report from Atrius® and Smart Energy Decisions (SED)
Previously titled "The State of Energy Management,” this year's data suggests energy management isn't an endpoint. Instead, it is the first of many essential parts of an integrated corporate sustainability journey. Predictably, energy reduction remains a primary component of sustainability strategies. Still, new and emerging megatrends suggest managing resource consumption is the first of many crucial steps to creating smarter, safer, and greener spaces.
This year's data regarding the current state of sustainability reporting and energy management reflects the experience and insight of 300+ industry professionals working at respected organizations in multiple sectors.

The Intersection of Technology and Sustainability
Megatrends are macro-level behavior patterns and movements that influence micro-level decisions and actions. These enormous changes happen beyond our ability to affect them, reshaping national economies and neighborhood businesses. Slow to materialize, it could be decades before we see the impacts of megatrends on corporate priorities and consumer purchasing.
The 2023 State of Corporate Sustainability Report revealed the impact of two previously independent megatrends beginning to intersect. The first is sustainability initiatives focused on limiting the effects of climate change, and the second is technology-based digital transformations.
Please scroll through the following for more of this year's major findings.Status Check: Progress on the Journey to Sustainability
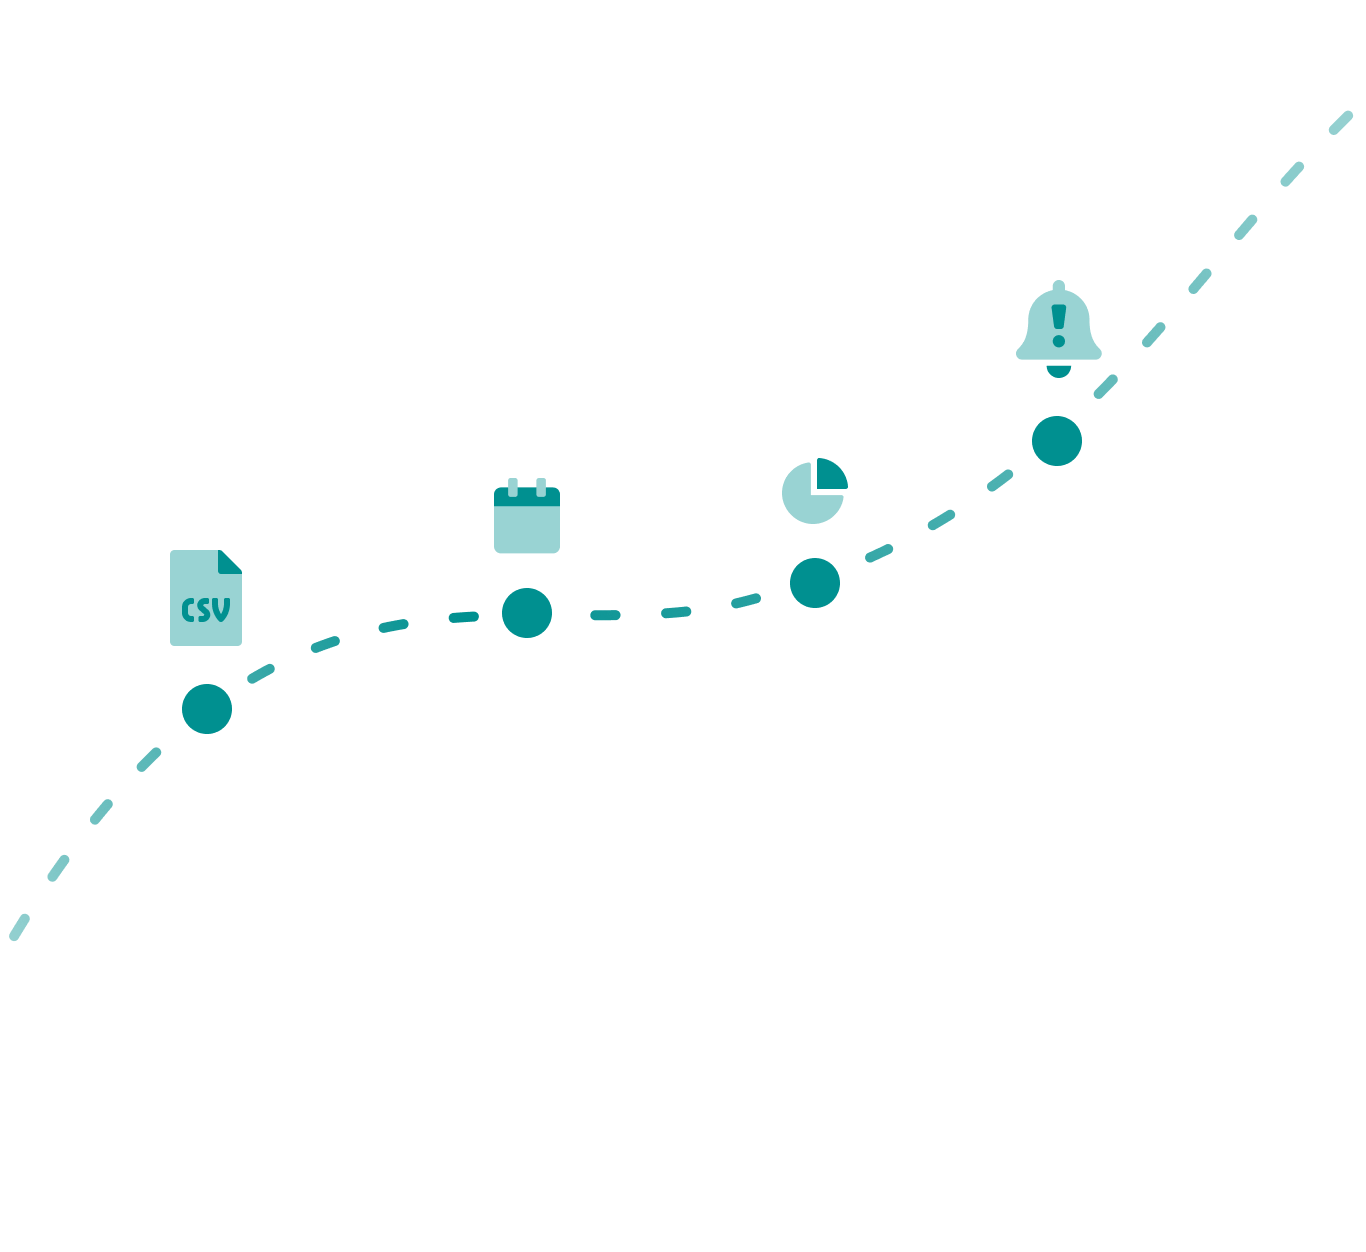
Sustainability derives from the Latin word "sustinere," meaning to hold, keep, or endure over a long period.
This definition aligns perfectly with describing sustainability as a journey - rather than a destination. So, for the first time, this year's survey includes questions to help identify key characteristics of how respondents view their progress on their journey towards greener spaces.
Question: Where do you see your organization on its journey to achieving sustainability goals?

Sustainability Commitments at Various Stages of the Journey
Organizations that identified as advanced, or in the middle, of their sustainability journeys were more committed to following through on these activities than teams just beginning sustainability activities, except for reporting.
According to this year's data, 46% of respondents who considered their organizations just starting sustainability journeys were more likely to commit to reporting than last year's 34%. This increase confirms the importance of sustainability reporting at the beginning, middle, and advanced stages of organizational sustainability programs.
Organizations identifying as “advanced” in their sustainability journey
Question: Which of the following sustainability or energy reduction goals is your organization committed to achieving?
Industries feeling “in the middle” in their sustainability journey
Question: Which of the following sustainability or energy reduction goals is your organization committed to achieving?
Industries feeling “at the beginning” in their sustainability journey
Question: Which of the following sustainability or energy reduction goals is your organization committed to achieving?
Industry breakdown
While a little over a quarter of organizations have set science-based target initiatives (SBTi), industrial (50%) and government (37%) sectors are leading the effort.
Biggest Drivers at Every Stage of the Journey: Better Data and More Automation
This year, 40% of respondents saw a substantial increase in their organizations investing in real-time and automated utility data collection compared to last year at 33%.
Question: How does your organization currently collect energy and sustainability data?
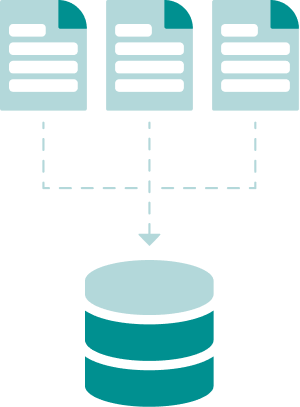
Data Quality Issues are a Major Barrier to Sustainability Success
Not surprisingly, data quality issues affected every stage of the sustainability journey. Organizations identifying as advanced (41%), in the middle (44%), and at the beginning (39%) hit data-related barriers to successfully implementing their sustainability strategies. Even though 50% of respondents have automated data collection, they are also using other methods, so it appears that many still lack solutions to manage the large volume of data.
Overwhelming, time-consuming data management is a giant hurdle blocking sustainability progress. Many survey respondents could drive ESG initiatives further and more efficiently with automated, high-quality data collection and analysis.
Organizations identifying as “advanced” in their sustainability journey
Question: Which of the following are barriers to successfully implementing your sustainability strategy?
Industries feeling “in the middle” in their sustainability journey
Question: Which of the following are barriers to successfully implementing your sustainability strategy?
Industries feeling “at the beginning” in their sustainability journey
Question: Which of the following are barriers to successfully implementing your sustainability strategy?
Reporting Benchmarks & Priorities
It’s important to note that anyone responsible for their organization’s sustainability or energy priorities is familiar with data management and reporting. However, there is a good chance those responsible are spending more time building these reports than they should be.
Accurate, comprehensive reporting is increasingly paramount as federally mandated reporting frameworks, financial disclosure requirements, and corporate ESG programs demand verifiable accountability.
As important as these frameworks are, they are still labor-intensive processes that require large amounts of data and formatting.
Deep Dive: How Organizations are Tracking
Survey data showed a 15-percentage point increase in consultants and service providers using spreadsheets to manage initiatives during the early stages of sustainability journeys. We expect this data reflects an increase in organizations contracting for third-party assistance with sustainability reporting. However, given the labor-intensive nature of manual data collection, the busier these providers become, the longer it takes them to produce their clients' reports. Further, the inability to track progress negatively affects goal accomplishment.
How Organizations are Reporting Progress
Other than corporate annual reports, year-end sustainability reporting methods vary, at least for now. Notably, CDP is almost twice as popular as the second choice, GRI, among buyer-focused organizations - energy customers (buyers) from commercial, industrial, institutional and government organizations - and ahead of the other reporting methods. We expect this data to evolve as discussions surrounding reporting frameworks intensify. It is also reasonable to expect these numbers to change as organizations shift focus from launching sustainability programs to measuring and reporting progress. Existing and new reporting solutions will impact future responses to this question.
Question: How does your organization report on year-end sustainability progress and goals?
The charts below detail reporting frameworks for all respondents, and compare buyer-focused organizations vs. suppliers and service providers.
3 Key Factors of Success: Funding, Data Centralization, and an Integrated Strategy
Energy and sustainability team members (59%) consider organizing data streams into a centralized location a higher priority than C-suite executives (34%) view this task (59% vs. 34%, respectively). The data shows similar results for external engagement and visibility of programs, both rated important to sustainability success by 52% of energy professionals and only 31% of corporate executives.
While disappointing for those looking for more urgent environmental action, these results aren't surprising. They could explain why developing business cases for the technical solutions that optimize operations is so difficult. The data also suggests how solutions providers can support energy managers in this effort.

Budgeting for Sustainability Success
More of this year's respondents said they did have the budget to achieve sustainability goals set by their organization, compared to last year's data. Similarly, fewer people answered this same question with no; they did not have sufficient budgets to achieve stated ESG goals. While it's easy to dismiss initiatives by insisting "there's no budget," providing sufficient resources is necessary to reach sustainability goals.
Question: In your opinion, based on the sustainability goals set by your organization, do you have the budget needed to achieve these goals?
This Year's Data (2023)
-
No (55%)
-
Yes (45%)
No
55%
Yes
45%
Last Year's Data (2022)
-
No (58%)
-
Yes (42%)
No
58%
Yes
42%
Data Centralization and Easy Access are critical for occupant awareness
Survey respondents in higher education placed a significantly higher emphasis on occupant awareness and engagement (84%) than participants in other industries.
In addition, people working in sustainability, facility, and energy roles prioritized this tactic higher than those in C-Suite level positions. This number is surprising considering the value of C-Suite executives engaging in and celebrating company achievements.

Leading Organizations are Integrating Sustainability Initiatives in Every Aspect of Business
The across-the-board increase in the degree to which organizations integrated sustainability into their business strategies is a big win. Many of us probably remember when sustainability was more of a "check box" activity for organizations.
But this year's results show people taking their corporate sustainability and energy management goals seriously.
Hopefully, this positive trend will continue, so these numbers rise as more business leaders launch sustainability journeys with the necessary resources to accelerate success.
Survey methodology
Smart Energy Decisions deployed an online survey on behalf of Atrius to energy, facility, and sustainability leaders in organizations across a variety of industries. The general survey was completed by 334 respondents.

Survey respondents by industry
Survey respondents by organization size (number of employees)

Survey respondents by role
To better understand the influence respondents had on sustainability, we asked them to identify what role they played in their company’s sustainability initiatives.

Survey respondents by job title
You made it all this way, why not get to know us a little bit?
Atrius delviers edge-to-cloud solutions enabling buildings to become smarter, safer, and greener. Check out some highlights from our resources section to learn more about what we do: